With Siddharth Kapoor - CBSE Class XI student, Delhi Public School, Gautam Buddh Nagar, Delhi.
In a previous blog titled Sovereign Gold Bonds : 28-Feb-21, we have highlighted the key advantages of Sovereign Gold Bonds (SGB). We have argued that with the exception of secondary market liquidity, SGB is a superior form of holding gold. In the table below we present a summary of the primary modes of holding gold. We have ignored Digital Gold as it is not a regulated product and has significant counter party risk.
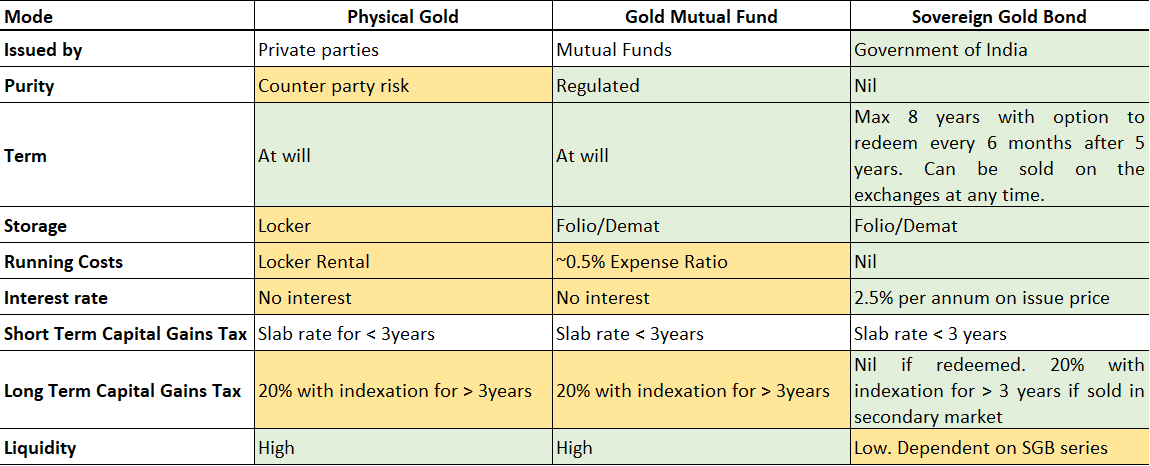
The above table indicates that SGBs are the superior form of holding gold except in terms of their liquidity. The purpose of this study is to first establish the levels of liquidity that exist in SGBs and then understand what drives SGB liquidity and hopefully come up with some simple rules on how to go about buying an SGB.
SGBs vs Gold ETFs
We have mentioned that SGBs are characterized by their low liquidity. We here try to establish how low this liquidity is as compared to the other more liquid form of holding gold such as the Gold ETF. As a first approximation we considered a window period from 1-Apr-21 to 31-Mar-22. In this period, we summed up the total volume of 49 SGBs traded on a daily basis. The daily trading volumes for the Nippon Gold ETF and SBI Gold ETF were also tabulated and converted to equivalent grams of gold. The data is presented as a box and whisker plot below.
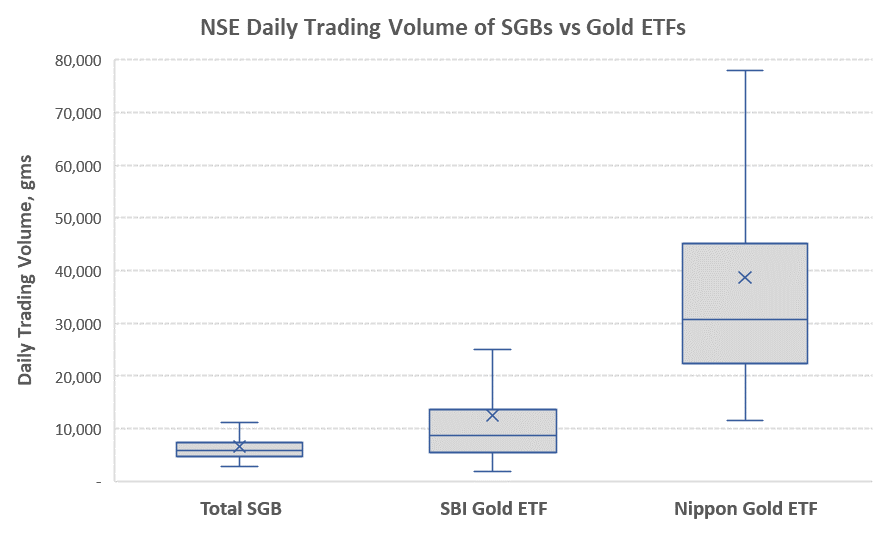
From the box and whisker plot shown above, it can be seen that despite adding the daily trading volume across 49 SGBs, total SGB trading volume averages around only 6500 gms per day vs 10,000 gms per day being traded through a single ETF such as the SBI Gold ETF. The Nippon Gold ETF has an even higher trading volume of about 30,000 gms of gold per day. The average trading volume of all 49 SGBs put together being only 6500gms per day would imply that the expected average trading volume per individual SGB would be in the range of 6500/49 ~133 gms per day. This is about 1/100th the daily trading volume of the SBI Gold ETF and 1/300th the daily trading volume of the Nippon Gold ETF. Clearly despite the significant advantages of investing in SGBs, the trading volume and hence the liquidity of individual SGBs is very low and a prospective investor must proceed with caution before making an investment.
Liquidity of individual SGBs
In the previous section we compared the total trading volume of all 49 SGBs versus two established Gold ETFs. It was established that SGBs as a family have low liquidity. However, do all SGBs have uniformly low liquidity ? or are there differences among them?. To understand this, we plot a box and whisker plot of daily trading volume of individual SGBs below:
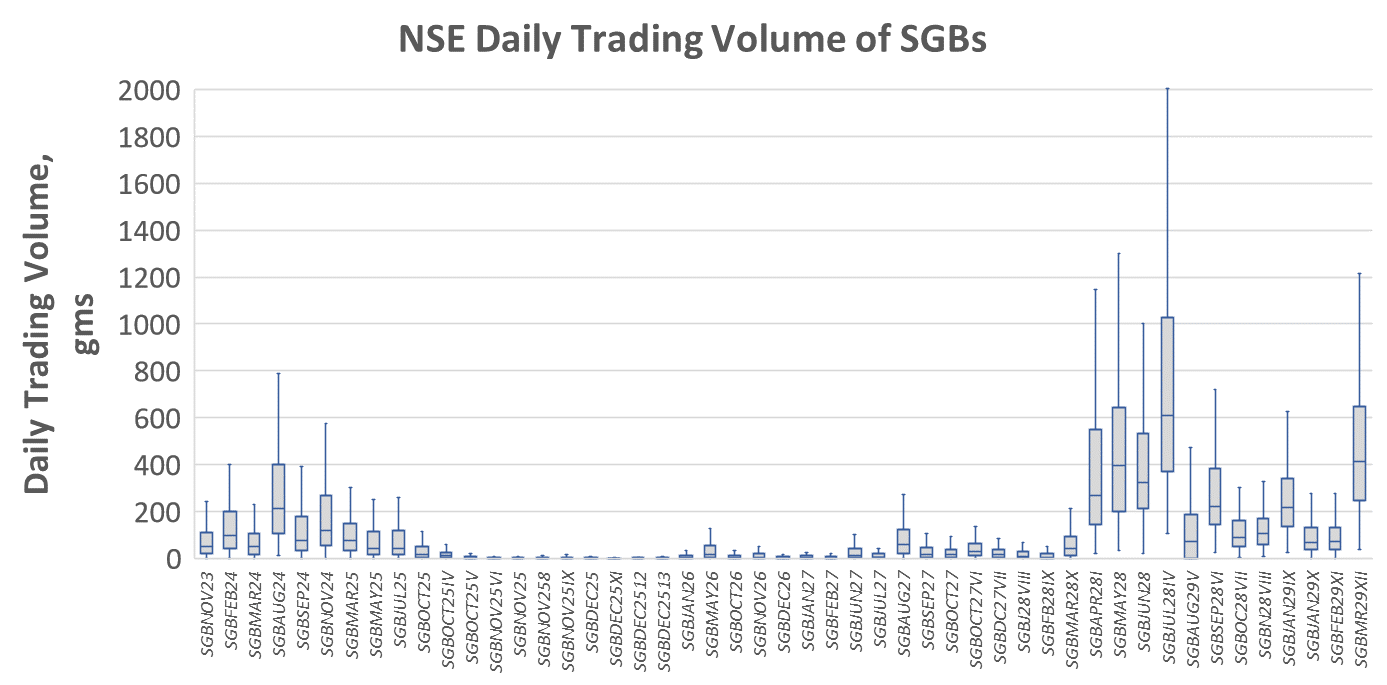
The above chart indicates that there exists a wide spread in the trading volume across individual SGBs. While SGBs on an average have a daily trading volume of ~133gms per day (as described in the previous section), there are individual SGBs which trade about 600 grams per day and some SGBs which do not trade at all. The implication is that while as a family SGBs have low liquidity, there are a few SGBs which have reasonable amounts of trading volume and it does make sense to understand which SGBs these are and what enables them to trade at higher daily trading volumes.
What drives SGB trading volume?
Our investigations revealed that the primary determinant of daily trading volume in a SGB is the number of outstanding units. i.e., the size of the SGB issue less the number of units surrendered. The below chart plots the daily trading volume of all SGBs and their corresponding number of outstanding units. A near perfect correlation is seen.
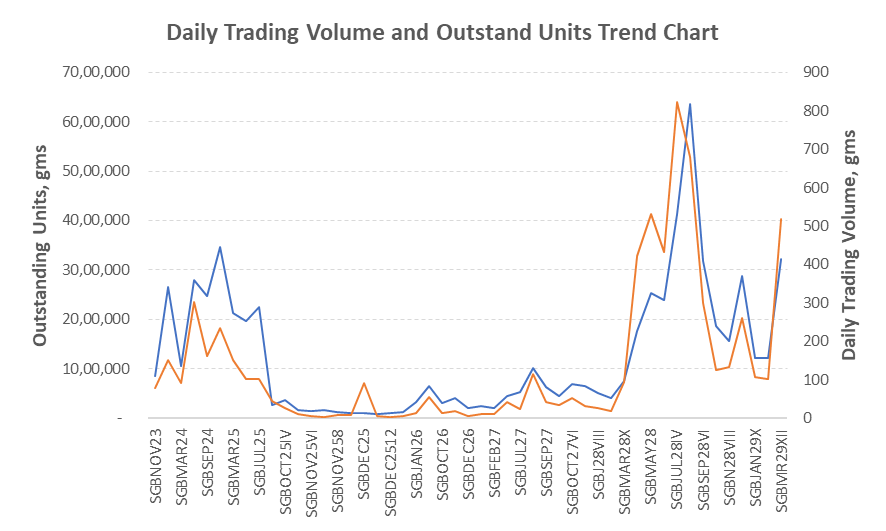
The blue line in the above chart (to be read off the primary y-axis of the left)is in near perfect consonance with the orange line which is daily trading volume (to be read off the the secondary y-axis on the right). The liquidity of an SGB in the secondary market is therefore primarily determined by the number of outstanding units. Outstanding units explain why the daily trading volumes of some specific SGBs is high and low for others.
Impact of liquidity on bid-ask spreads
It is a known fact that low liquidity drives wider spreads between buyers and sellers in the market. Due to insufficient trading volumes, there are fewer buyer “bids” and also fewer seller “asks”. This creates gaps in expectations and invariably leads to a higher bid-ask spread. The scatter plot below plots the bid-ask spread (i.e the difference between the lowest ask and the highest bid) versus the average daily trading volume of SGBs. This is a snap shot of Bid-Ask spreads taken in a short window on 9-Mar-23.

The graph above indicates that the Bid-Ask Spread and the average trading volume of SGBs have an inverse relationship. Many other factors can also affect the Bid-Ask Spread, but they only seem to have a marginal impact on the Average Trading Volume. The SGB's liquidity is hence the primary significant factor affecting the Bid-Ask Spread.
Age of an SGB and its impact on discount in SGB price
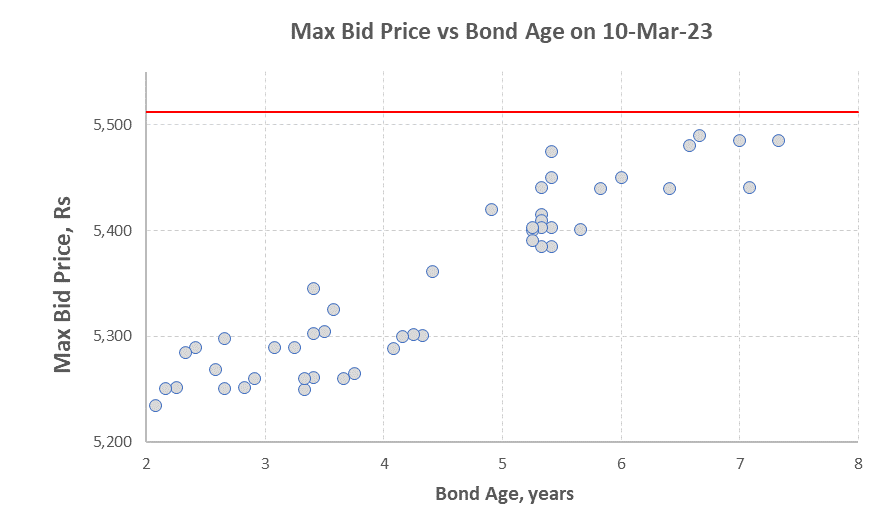
In the above scatter plot, the age of the bond has been calculated from the date of its issue to February 28th 2023.The Maximum Bid Price has been taken on 9th March,2023 and the price of 999 purity gold has been taken from the website of Indian Bullion and Jewellers Association (IBJA) as on 9th March 2023 which was ?5,512/gms. The above chart indicates that all SGBs trade at a discount to the price of 999 gold. The discount can be as high as about 300 Rs which is about 6% of the prevailing price of gold. It can also be seen from the above chart that as the age of bond increases the discount i.e., the difference between the price of gold and the maximum bid price decreases which means that the bonds closer to maturity, trade at the least discount to the price of gold. It is also interesting to note that around the bond age of 5 years a sudden increase in the bid price happens resulting in a drop in the discount. This is most likely because after reaching 5 years of age, SGB holders have the option to redeem the bond at the prevailing price of gold on specific dates which occur at 6 month intervals. As redemption of SGBs is a tax-free event, market participants are ready to bid higher for bonds which are close to or above 5 years of age.
Opportunity to select a sweet spot for SGB purchase
For an investor wishing to take a position in gold, the Sovereign Gold Bond is by far the superior investment vehicle. Please refer to this blog for a detailed discussion on this. The major drawback SGBs suffer from is their low liquidity. We have shown that SGBs with particularly low liquidity results in high bid-ask spreads – and these SGBs should definitely be avoided. On the other hand we have also shown that due to low liquidity in general SGBs trade at a discount to the prevailing price of 999 gold and this discount reduces as the SGB ages. The ideal combination for a prospective buyer would be an SGB trading at a hefty discount and simultaneously having a low bid-ask spread. This will combine the benefit of buying an SGB at a lower price than the published 999 gold price and also having the benefit of reasonable liquidity. The scatter chart below plots the discount rates of SGBs versus their bid-ask spreads.
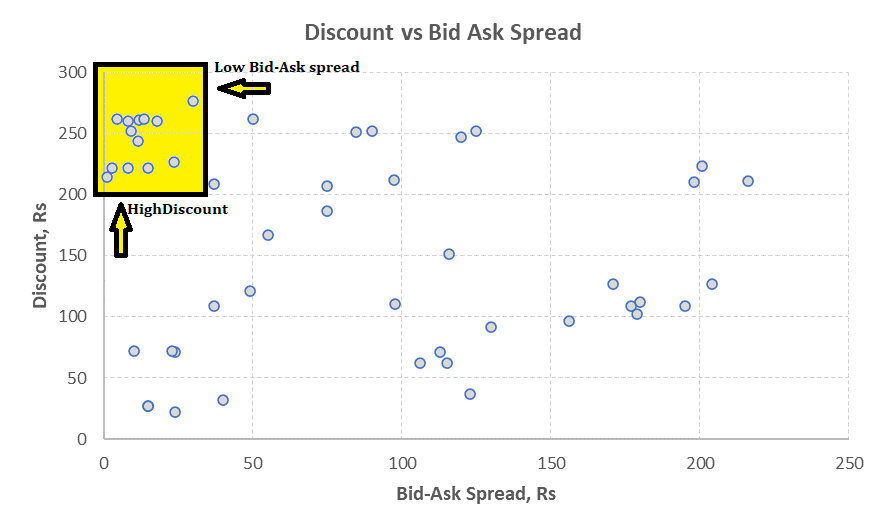
The chart seems to be a random scatter with no clear relationship between the discount and the bid-ask spread. The small shaded box in the top left hand corner indicates the opportunity of being able to buy relatively liquid SGBs with low bid-ask spreads at discounted prices. All other SGBs may be safely ignored. It must be added that there likely will be other factors affecting the discount – including the interest payment dates of each SGB. Typically closer to the semi-annual interest payment date, the bond price is likely to increase and then drop ex-interest – very similar to dividends in stocks. We feel that impact will be in the range of about 1% - and is a second order effect.
How to choose a suitable SGB
Through our discussions we can tentatively propose the following steps for choosing an appropriate SGB :
Step 1 – never buy a fresh issue directly from the RBI. Reason one being we will know the outstanding units (and hence the liquidity) only after the issue. If the issue lands up with low subscription there will be fewer outstanding units making the issue illiquid. The second reason not to buy a fresh issue is that the issue price fixed by the RBI is the prevailing 999 price of gold as quoted by IBJA. If pre-existing SGBs issued earlier are trading at a significant discount to the issue price – why buy at the issue price which is higher?
Step 2 – choose existing issues in the top-left hand corner of the above chart and buy from the secondary market through the exchanges.
Step 3 - of the issues within the shaded box, understand which bonds are close to their interest payment dates and choose judiciously.
It may be argued that for certain investors who wish to hold to maturity, secondary market liquidity of a SGB is immaterial and it may be better to buy fresh issues from the RBI directly. However, even if liquidity is not a factor, the investor must also not ignore the significant discounts at which she can pick up SGBs from the secondary market instead of a fresh issue. The downside of this approach is that the investor needs a demat account to be able to buy SGBs from the secondary market and needs to pay a brokerage for secondary market purchase. Nevertheless our conclusion is that there remains significant justification to avoid primary market issues and search for suitably liquid SGBs from the secondary market to build a SGB portfolio.
In a previous blog titled Sovereign Gold Bonds : 28-Feb-21, we have highlighted the key advantages of Sovereign Gold Bonds (SGB). We have argued that with the exception of secondary market liquidity, SGB is a superior form of holding gold. In the table below we present a summary of the primary modes of holding gold. We have ignored Digital Gold as it is not a regulated product and has significant counter party risk.
The above table indicates that SGBs are the superior form of holding gold except in terms of their liquidity. The purpose of this study is to first establish the levels of liquidity that exist in SGBs and then understand what drives SGB liquidity and hopefully come up with some simple rules on how to go about buying an SGB.
SGBs vs Gold ETFs
We have mentioned that SGBs are characterized by their low liquidity. We here try to establish how low this liquidity is as compared to the other more liquid form of holding gold such as the Gold ETF. As a first approximation we considered a window period from 1-Apr-21 to 31-Mar-22. In this period, we summed up the total volume of 49 SGBs traded on a daily basis. The daily trading volumes for the Nippon Gold ETF and SBI Gold ETF were also tabulated and converted to equivalent grams of gold. The data is presented as a box and whisker plot below.
From the box and whisker plot shown above, it can be seen that despite adding the daily trading volume across 49 SGBs, total SGB trading volume averages around only 6500 gms per day vs 10,000 gms per day being traded through a single ETF such as the SBI Gold ETF. The Nippon Gold ETF has an even higher trading volume of about 30,000 gms of gold per day. The average trading volume of all 49 SGBs put together being only 6500gms per day would imply that the expected average trading volume per individual SGB would be in the range of 6500/49 ~133 gms per day. This is about 1/100th the daily trading volume of the SBI Gold ETF and 1/300th the daily trading volume of the Nippon Gold ETF. Clearly despite the significant advantages of investing in SGBs, the trading volume and hence the liquidity of individual SGBs is very low and a prospective investor must proceed with caution before making an investment.
Liquidity of individual SGBs
In the previous section we compared the total trading volume of all 49 SGBs versus two established Gold ETFs. It was established that SGBs as a family have low liquidity. However, do all SGBs have uniformly low liquidity ? or are there differences among them?. To understand this, we plot a box and whisker plot of daily trading volume of individual SGBs below:
The above chart indicates that there exists a wide spread in the trading volume across individual SGBs. While SGBs on an average have a daily trading volume of ~133gms per day (as described in the previous section), there are individual SGBs which trade about 600 grams per day and some SGBs which do not trade at all. The implication is that while as a family SGBs have low liquidity, there are a few SGBs which have reasonable amounts of trading volume and it does make sense to understand which SGBs these are and what enables them to trade at higher daily trading volumes.
What drives SGB trading volume?
Our investigations revealed that the primary determinant of daily trading volume in a SGB is the number of outstanding units. i.e., the size of the SGB issue less the number of units surrendered. The below chart plots the daily trading volume of all SGBs and their corresponding number of outstanding units. A near perfect correlation is seen.
The blue line in the above chart (to be read off the primary y-axis of the left)is in near perfect consonance with the orange line which is daily trading volume (to be read off the the secondary y-axis on the right). The liquidity of an SGB in the secondary market is therefore primarily determined by the number of outstanding units. Outstanding units explain why the daily trading volumes of some specific SGBs is high and low for others.
Impact of liquidity on bid-ask spreads
It is a known fact that low liquidity drives wider spreads between buyers and sellers in the market. Due to insufficient trading volumes, there are fewer buyer “bids” and also fewer seller “asks”. This creates gaps in expectations and invariably leads to a higher bid-ask spread. The scatter plot below plots the bid-ask spread (i.e the difference between the lowest ask and the highest bid) versus the average daily trading volume of SGBs. This is a snap shot of Bid-Ask spreads taken in a short window on 9-Mar-23.
The graph above indicates that the Bid-Ask Spread and the average trading volume of SGBs have an inverse relationship. Many other factors can also affect the Bid-Ask Spread, but they only seem to have a marginal impact on the Average Trading Volume. The SGB's liquidity is hence the primary significant factor affecting the Bid-Ask Spread.
Age of an SGB and its impact on discount in SGB price
In the above scatter plot, the age of the bond has been calculated from the date of its issue to February 28th 2023.The Maximum Bid Price has been taken on 9th March,2023 and the price of 999 purity gold has been taken from the website of Indian Bullion and Jewellers Association (IBJA) as on 9th March 2023 which was ?5,512/gms. The above chart indicates that all SGBs trade at a discount to the price of 999 gold. The discount can be as high as about 300 Rs which is about 6% of the prevailing price of gold. It can also be seen from the above chart that as the age of bond increases the discount i.e., the difference between the price of gold and the maximum bid price decreases which means that the bonds closer to maturity, trade at the least discount to the price of gold. It is also interesting to note that around the bond age of 5 years a sudden increase in the bid price happens resulting in a drop in the discount. This is most likely because after reaching 5 years of age, SGB holders have the option to redeem the bond at the prevailing price of gold on specific dates which occur at 6 month intervals. As redemption of SGBs is a tax-free event, market participants are ready to bid higher for bonds which are close to or above 5 years of age.
Opportunity to select a sweet spot for SGB purchase
For an investor wishing to take a position in gold, the Sovereign Gold Bond is by far the superior investment vehicle. Please refer to this blog for a detailed discussion on this. The major drawback SGBs suffer from is their low liquidity. We have shown that SGBs with particularly low liquidity results in high bid-ask spreads – and these SGBs should definitely be avoided. On the other hand we have also shown that due to low liquidity in general SGBs trade at a discount to the prevailing price of 999 gold and this discount reduces as the SGB ages. The ideal combination for a prospective buyer would be an SGB trading at a hefty discount and simultaneously having a low bid-ask spread. This will combine the benefit of buying an SGB at a lower price than the published 999 gold price and also having the benefit of reasonable liquidity. The scatter chart below plots the discount rates of SGBs versus their bid-ask spreads.
The chart seems to be a random scatter with no clear relationship between the discount and the bid-ask spread. The small shaded box in the top left hand corner indicates the opportunity of being able to buy relatively liquid SGBs with low bid-ask spreads at discounted prices. All other SGBs may be safely ignored. It must be added that there likely will be other factors affecting the discount – including the interest payment dates of each SGB. Typically closer to the semi-annual interest payment date, the bond price is likely to increase and then drop ex-interest – very similar to dividends in stocks. We feel that impact will be in the range of about 1% - and is a second order effect.
How to choose a suitable SGB
Through our discussions we can tentatively propose the following steps for choosing an appropriate SGB :
Step 1 – never buy a fresh issue directly from the RBI. Reason one being we will know the outstanding units (and hence the liquidity) only after the issue. If the issue lands up with low subscription there will be fewer outstanding units making the issue illiquid. The second reason not to buy a fresh issue is that the issue price fixed by the RBI is the prevailing 999 price of gold as quoted by IBJA. If pre-existing SGBs issued earlier are trading at a significant discount to the issue price – why buy at the issue price which is higher?
Step 2 – choose existing issues in the top-left hand corner of the above chart and buy from the secondary market through the exchanges.
Step 3 - of the issues within the shaded box, understand which bonds are close to their interest payment dates and choose judiciously.
It may be argued that for certain investors who wish to hold to maturity, secondary market liquidity of a SGB is immaterial and it may be better to buy fresh issues from the RBI directly. However, even if liquidity is not a factor, the investor must also not ignore the significant discounts at which she can pick up SGBs from the secondary market instead of a fresh issue. The downside of this approach is that the investor needs a demat account to be able to buy SGBs from the secondary market and needs to pay a brokerage for secondary market purchase. Nevertheless our conclusion is that there remains significant justification to avoid primary market issues and search for suitably liquid SGBs from the secondary market to build a SGB portfolio.