Indian markets are at an all time high. Short term interest rates are at a low. Current and prospective inflation is arguably high. While the expected return for equity is muted, investing in debt offers even poorer prospects. Short term real interest rates are negative. The only way to increase yields above inflation without compromising on credit quality is to invest in longer duration sovereign debt products. The RBI is caught between inflation on one side and an imperative to keep interest rates low to provide an impetus to growth. This struggle is seen in the rather steep yield curve. The RBI has some control on short term rates through the repo, it however has to bow down to market forces at the longer end of the curve. Long duration products are thus in our mind, at significant duration risk due to a reasonable probability that interest rates are likely to rise in the medium term (3 years). It is very likely that debt investment in the current climate is likely to generate sub-inflationary returns over the medium term. The situation for Indian investors can further be exacerbated in the case of increase in US$ bond yields, which could result in a flight of hot money from India resulting in significant pain in our debt and equity markets.
Staying within one’s chosen allocation to risky equity in our minds is a key component of staying the long course and allowing investments to grow commensurate with risk appetites – this enables us to ride storms. Nevertheless, we feel it is also appropriate in light of the current tricky investment climate in particular, to sufficiently diversify allocations. We hope through this diversification we are not only protected through our appropriate allocation to equity, but we are also sufficiently diversified in that our risky basket does not drop down as much as the market.
Disclaimer:
Call this piece a diversification for dummies if you will. It is likely that this work has errors, nevertheless, we hope that it will give us a base level approximation of how an Indian investor can achieve diversification. We would also like to state that the investment vehicles used in this piece to explore diversification are by no means exhaustive.
The first principal we follow for diversification is to decide how much risky exposure we can tolerate. It is within this “risky” area that we wish to explore diversification. Before exploring the investment vehicles available for diversification, it may be useful to consider what happens during times of stress – or rather “risk off” as they say. We have seen during such times, there is a flow of “hot” money out of India accompanied by a steep drop in Indian equity markets and a weakening of the Indian rupee. The first thought that comes to mind is to have exposure to $denominated assets. The logic is that, $denominated assets such as gold or US based stock / indices will gain relatively (in rupee terms) at such times due to the $ appreciation. To understand this further we considered a combination of three assets viz. : (a) the NIFTY-50 which is a rupee asset, (b) Gold which is quoted in $ and (c)the S&P-500 which is a $ asset. We tabulated the quarterly returns of each of the above assets since January 2008 (as this data was readily available from Yahoo finance) and then selected quarters with NIFTY-50 returns worse than a 2.5% drop:

The table above shows that, the NIFTY-50 dropped by more than 2.5% in 14 of the 54 quarters since January 2008. . In these 14 quarters the S&P-500 has outperformed the NIFY-50 13 times and generated a positive return in 8. GOLD on the other hand has outperformed the NIFTY-50 again in 13 of the 14 quarters and has generated a positive return in 12. This seems to indicate that both Gold and the S&P-500 perform better than the NIFTY-50 when the NIFTY-50 drops precipitously. This is borne out further when a correlation is run on the entire 13 year data of monthly return between the 3 assets ie NIFTY-50, S&P-500 and GOLD :

Correlation numbers between any two quantities range from one to minus one. Positive one indicates perfect tandem movement of both quantities in the same direction, while minus one indicates perfect tandem movement of the two quantities in opposing directions. A correlation number close to zero indicates that the two quantities do not move in tandem either positively or negatively. The close to zero correlation numbers for Gold against both the NIFTY-50 and NASDAQ-100 in the above table indicates that Gold movements are not correlated to NIFTY-50 and S&P-500 movements and offers significant diversification benefit. On the other hand the 0.373 correlation between the S&P-500 and NIFTY-50 indicates that the S&P-500 is mildly correlated to the NIFTY-50 and offers at-least some diversification benefits.
Reducing volatility without compromising return:
The above discussion focusses on the relative movements of the NIFTY-50, S&P-500 and GOLD. It gives a thought process of how to reduce volatility in the portfolio by combining assets that are mildly correlated or not correlated. Combining assets is about reducing volatility subject to not compromising return. i.e ideally we would want to reduce volatility while increasing return or at-least without reducing return. Each of the assets above generated different returns over the 13 year period of interest. The table below shows the annualized returns and standard deviations (volatility):

The subject of this blog is to combine the above three assets in a way that will reduce volatility while increasing return or at-least not compromising on return. Without getting into the technical details, we provide below a ternary plot of volatility and return against the three assets (based on 13 year historical data since January 2008):
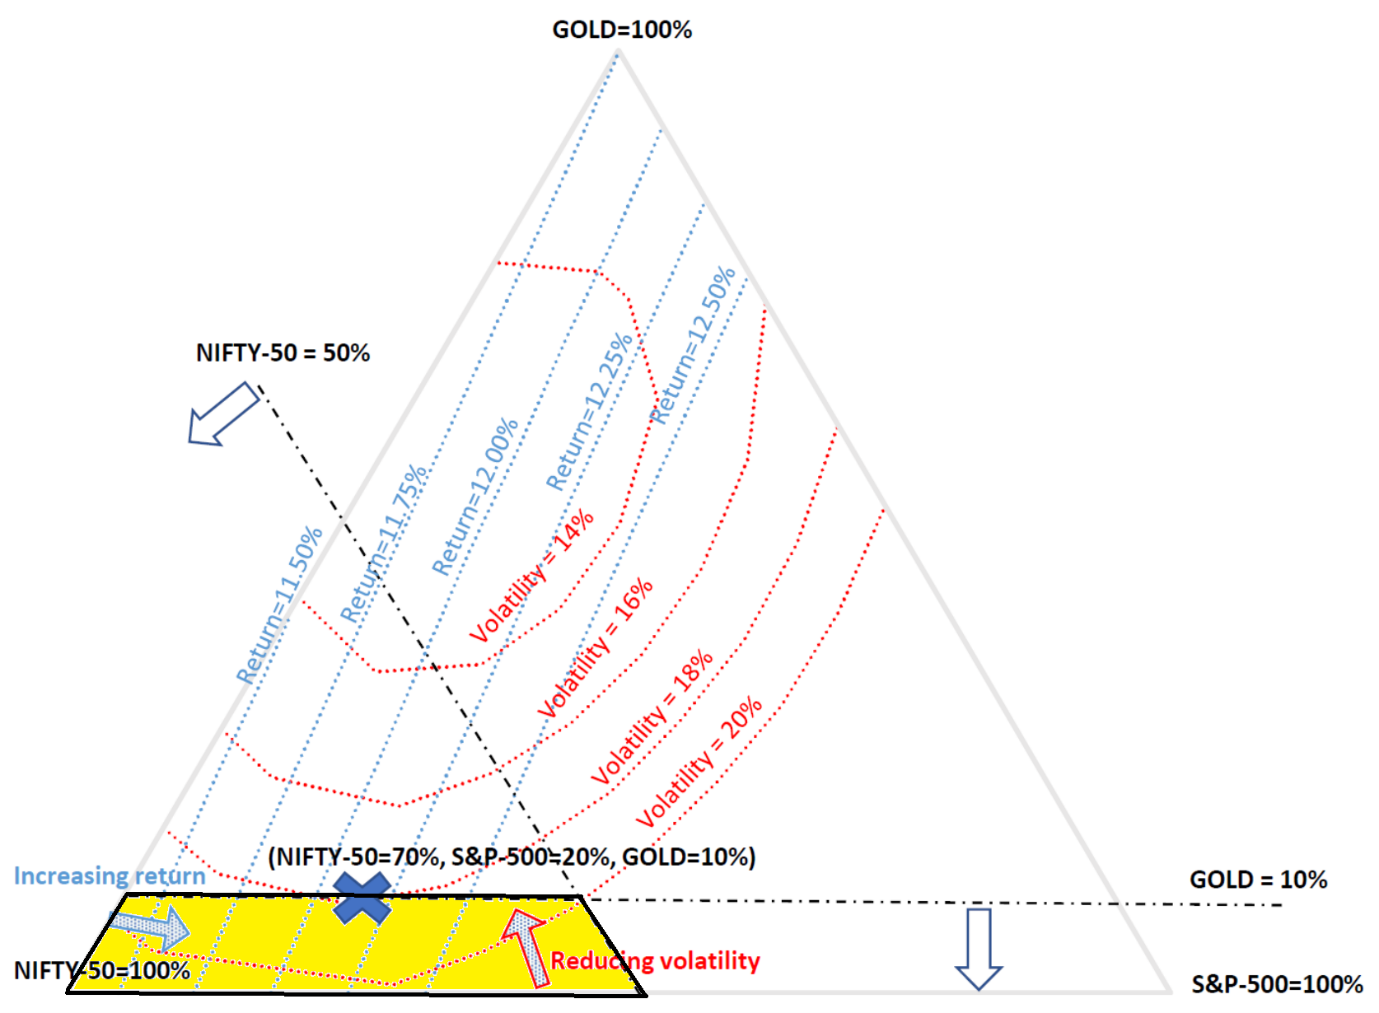
Any point in the triangle above represents a combination of the 3 assets. Each vertex of the triangle represents 100% of the asset labelled. Any point along any of the edges of the triangle represent a combination of two assets and zero percentage of the third asset. On the above triangle we have superimposed two types of curves. The first set of red curves represent points of equal volatility. The second set of light blue curves represent points of equal return. We now place two restrictions on the asset combination. The first being that we will allow no less than a 50% exposure to the NIFTY-50. The second restriction we place is that Gold should not get more than a 10% allocation. These two restrictions are arbitrary and can be changed based upon client specific requirements. The black dashed lines represent these restrictions. The yellow shaded region in the bottom left of the figure shows the area of interest. In this region as we move vertically up (more Gold) we reduce volatility and as we move right (more S&P-500) we increase return. The sweet spot (marked by the big blue cross) seems to be 70% NIFTY-50, 20% S&P-500 and 10% GOLD. At this point the volatility is 18% and the return is around 12.12%. Lets put it in a table to compare better :
The table indicates that we can increase return modestly from the NIFTY-50 return of 11.33% to 12.12% (an increase of about 0.8% per annum) combined with a significant simultaneous reduction in standard deviation from 21.92% for the NIFTY-50 to 18% by choosing a suitable combination of 70% NIFTY-50, 20% S&P-500 and 10% GOLD. Do note that this is based on historical data over the last 13 years. The past is not a predictor of the future. This exercise runs the risk of trying to be precisely right about something and ending up being absolutely wrong about (or rather ignoring) everything! Implementation of real portfolios must be client centric and grounded with a host of other drag factors such as risk appetite, exchange rates, fund managements costs and taxes. Once again with abundant caution we urge the reader to note that this post could have many errors. The conclusions should not be construed as a recommendation but only an instructive starting point for a more detailed investigation.
Staying within one’s chosen allocation to risky equity in our minds is a key component of staying the long course and allowing investments to grow commensurate with risk appetites – this enables us to ride storms. Nevertheless, we feel it is also appropriate in light of the current tricky investment climate in particular, to sufficiently diversify allocations. We hope through this diversification we are not only protected through our appropriate allocation to equity, but we are also sufficiently diversified in that our risky basket does not drop down as much as the market.
Disclaimer:
Call this piece a diversification for dummies if you will. It is likely that this work has errors, nevertheless, we hope that it will give us a base level approximation of how an Indian investor can achieve diversification. We would also like to state that the investment vehicles used in this piece to explore diversification are by no means exhaustive.
The first principal we follow for diversification is to decide how much risky exposure we can tolerate. It is within this “risky” area that we wish to explore diversification. Before exploring the investment vehicles available for diversification, it may be useful to consider what happens during times of stress – or rather “risk off” as they say. We have seen during such times, there is a flow of “hot” money out of India accompanied by a steep drop in Indian equity markets and a weakening of the Indian rupee. The first thought that comes to mind is to have exposure to $denominated assets. The logic is that, $denominated assets such as gold or US based stock / indices will gain relatively (in rupee terms) at such times due to the $ appreciation. To understand this further we considered a combination of three assets viz. : (a) the NIFTY-50 which is a rupee asset, (b) Gold which is quoted in $ and (c)the S&P-500 which is a $ asset. We tabulated the quarterly returns of each of the above assets since January 2008 (as this data was readily available from Yahoo finance) and then selected quarters with NIFTY-50 returns worse than a 2.5% drop:
The table above shows that, the NIFTY-50 dropped by more than 2.5% in 14 of the 54 quarters since January 2008. . In these 14 quarters the S&P-500 has outperformed the NIFY-50 13 times and generated a positive return in 8. GOLD on the other hand has outperformed the NIFTY-50 again in 13 of the 14 quarters and has generated a positive return in 12. This seems to indicate that both Gold and the S&P-500 perform better than the NIFTY-50 when the NIFTY-50 drops precipitously. This is borne out further when a correlation is run on the entire 13 year data of monthly return between the 3 assets ie NIFTY-50, S&P-500 and GOLD :
Correlation numbers between any two quantities range from one to minus one. Positive one indicates perfect tandem movement of both quantities in the same direction, while minus one indicates perfect tandem movement of the two quantities in opposing directions. A correlation number close to zero indicates that the two quantities do not move in tandem either positively or negatively. The close to zero correlation numbers for Gold against both the NIFTY-50 and NASDAQ-100 in the above table indicates that Gold movements are not correlated to NIFTY-50 and S&P-500 movements and offers significant diversification benefit. On the other hand the 0.373 correlation between the S&P-500 and NIFTY-50 indicates that the S&P-500 is mildly correlated to the NIFTY-50 and offers at-least some diversification benefits.
Reducing volatility without compromising return:
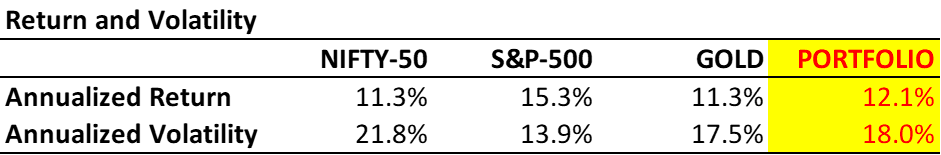
The above discussion focusses on the relative movements of the NIFTY-50, S&P-500 and GOLD. It gives a thought process of how to reduce volatility in the portfolio by combining assets that are mildly correlated or not correlated. Combining assets is about reducing volatility subject to not compromising return. i.e ideally we would want to reduce volatility while increasing return or at-least without reducing return. Each of the assets above generated different returns over the 13 year period of interest. The table below shows the annualized returns and standard deviations (volatility):
The subject of this blog is to combine the above three assets in a way that will reduce volatility while increasing return or at-least not compromising on return. Without getting into the technical details, we provide below a ternary plot of volatility and return against the three assets (based on 13 year historical data since January 2008):
Any point in the triangle above represents a combination of the 3 assets. Each vertex of the triangle represents 100% of the asset labelled. Any point along any of the edges of the triangle represent a combination of two assets and zero percentage of the third asset. On the above triangle we have superimposed two types of curves. The first set of red curves represent points of equal volatility. The second set of light blue curves represent points of equal return. We now place two restrictions on the asset combination. The first being that we will allow no less than a 50% exposure to the NIFTY-50. The second restriction we place is that Gold should not get more than a 10% allocation. These two restrictions are arbitrary and can be changed based upon client specific requirements. The black dashed lines represent these restrictions. The yellow shaded region in the bottom left of the figure shows the area of interest. In this region as we move vertically up (more Gold) we reduce volatility and as we move right (more S&P-500) we increase return. The sweet spot (marked by the big blue cross) seems to be 70% NIFTY-50, 20% S&P-500 and 10% GOLD. At this point the volatility is 18% and the return is around 12.12%. Lets put it in a table to compare better :
The table indicates that we can increase return modestly from the NIFTY-50 return of 11.33% to 12.12% (an increase of about 0.8% per annum) combined with a significant simultaneous reduction in standard deviation from 21.92% for the NIFTY-50 to 18% by choosing a suitable combination of 70% NIFTY-50, 20% S&P-500 and 10% GOLD. Do note that this is based on historical data over the last 13 years. The past is not a predictor of the future. This exercise runs the risk of trying to be precisely right about something and ending up being absolutely wrong about (or rather ignoring) everything! Implementation of real portfolios must be client centric and grounded with a host of other drag factors such as risk appetite, exchange rates, fund managements costs and taxes. Once again with abundant caution we urge the reader to note that this post could have many errors. The conclusions should not be construed as a recommendation but only an instructive starting point for a more detailed investigation.