This blog is a continuation of last month’s blog. In last month’s blog we discussed at length the obfuscation around the word “Total” in Total Expense Ratio (TER) in fund fact sheets. We showed with some real examples that the return in the Nett Asset Value (NAV) of a fund does not lag behind its benchmark by only the reported TER. In fact the actual lag in returns defined as Tracking Difference (TD) between the NAV of a fund and its benchmark could be nearly an order of magnitude higher. We argued that TD was a better measure to look at than TER. We also explained that Index ETFs have a lower Tracking Differences (TD) than index mutual funds. We argued that TD is an important measure for index mutual funds, while for ETFs though useful, it still did not provide the complete picture - the reason being the impact of secondary market trading and price discovery. While last month’s blog was about the difference in return between the NAV of a fund and its benchmark (also known as Tracking Difference- TD), this month we will discuss how secondary market price discovery of ETF units can be at significant variance with the NAV returns of an ETF and also the benchmark.
The price of an ETF in the secondary market and its NAV fluctuates intra-day. Our interest is in finding out what is the discrepancy between the price of an ETF on the exchange and its benchmark. While doing this on an intra-day basis is cumbersome, as a proxy we have downloaded the end of day prices of ETF D. We will compare the daily return of the end of day prices of ETF D versus the daily return of the end of day NAV of the ETF versus the daily return in the Total Return Index of the benchmark (in this case the NIFTY 50 TRI).
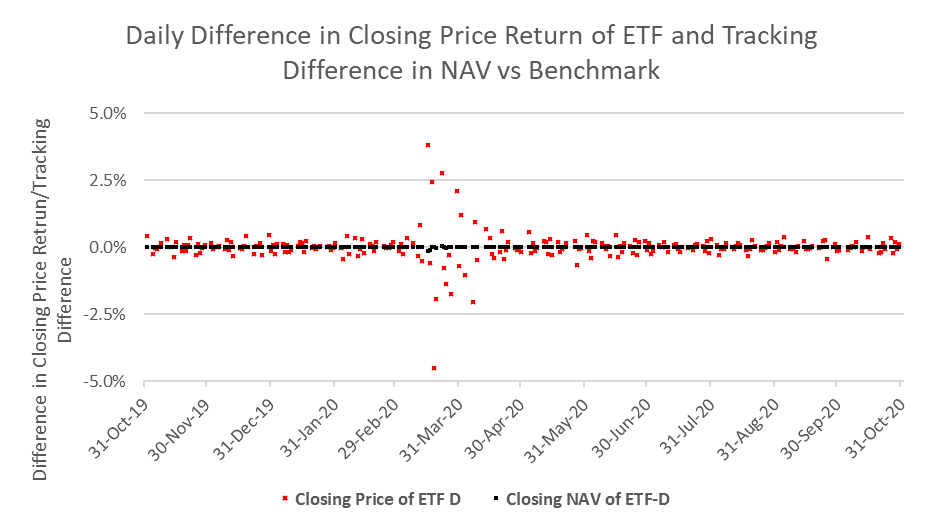
As is evident from the chart above, the daily return in the closing price of ETF D (Price Return – Benchmark Return represented by red dot) as traded in the secondary markets deviates significantly from the daily return of the benchmark. In-fact there are days around March and April where the deviation in daily returns can be as high as 4.0% positive and as low as 5.0% negative. Clearly the secondary market is not as efficient as we would like it to be. Around the months of March and April when volatility was high, the deviations jump even more and could have put an investor in the ETF at a significant advantage/dis-advantage based on which side his price got locked in. In contrast the Tracking Difference (TD i.e NAV return – Benchmark Return represented by black dot) of the fund deviates significantly less.
It would be instructive to compare how the variation of the secondary market price daily returns of this ETF from its benchmark compares against daily difference in returns of its own NAV versus the benchmark and one of the best index mutual fund difference in NAV return versus the benchmark return. This chart is provided below:
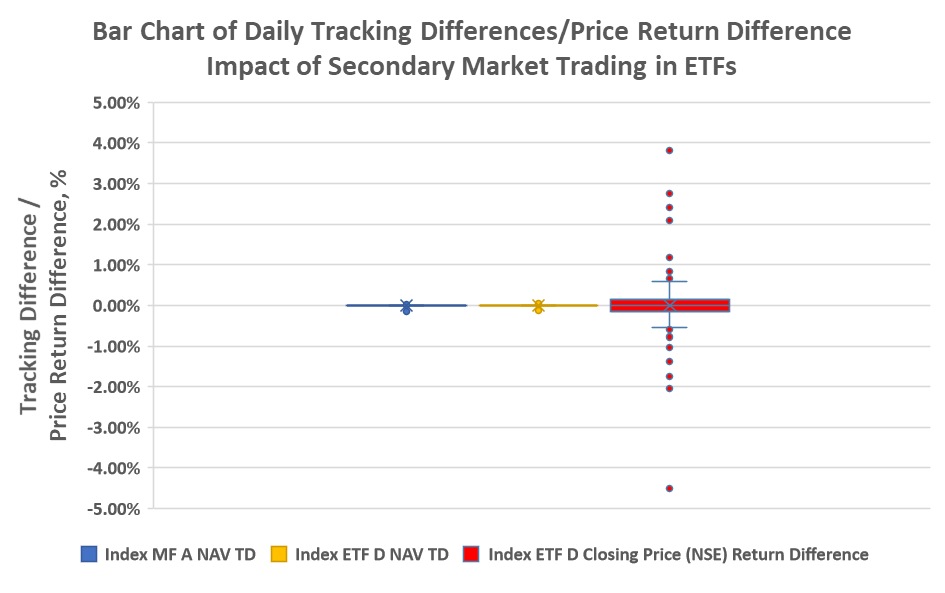
The spread in the daily closing price return difference of ETF D is significantly higher than the spreads in the return difference in ETF D NAV and the mutual index fund A NAV. The scale of the Y-axis of the above two graphs is not suitable in showing the full story (especially the Return Difference Averages). A third way to capture the differences is given below in a summarized table:

The above table encapsulates the complexity involved in ETFs. Let us assume that an investor buys his ETF units at the end of day. He has to buy at the end of day closing price. This is because, the investor gets to buy/sell units only at the secondary market price and not at the NAV of the ETF. The annualized standard deviation of the closing price return difference is about 50x (9.02% vs about 0.18%) that of the standard deviations in NAV of the ETF and/or the index mutual fund !! This implies that an investor in ETF D can expect significant uncertainty and deviation from the benchmark while purchasing/selling ETF units in the secondary market. So, even though the NAV of ETF D has a lower tracking difference (TD) than the NAV of index mutual A, in reality the investor cannot buy ETF D at its NAV, but has to buy ETF D at the secondary market determined price which can be at significant variation from the benchmark. Typically ETFs hire Authorized Participants (see http://passivefunds.in/index-funds-etfs/ for more information) to provide the necessary liquidity in the secondary market and ensure large deviations from the benchmark do not occur. However it seems at-least in the case of ETF D in the months of March and April when volatility was high, the liquidity provided was insufficient. Index ETFs provide the ability to purchase intra-day and not be restricted to end-of-day quotes from the fund. Nevertheless it is our position that for the investor who simply wants exposure to the index, it may be prudent to accept a slightly higher tracking difference (in terms of NAV) and go with a low cost index mutual fund instead of an index ETF. This way the investor can have more certainty on the price at which units are bought/sold. This index mutual fund route is also likely to more truthfully track performance (lower Tracking Difference (TD)) of the underlying index.
The price of an ETF in the secondary market and its NAV fluctuates intra-day. Our interest is in finding out what is the discrepancy between the price of an ETF on the exchange and its benchmark. While doing this on an intra-day basis is cumbersome, as a proxy we have downloaded the end of day prices of ETF D. We will compare the daily return of the end of day prices of ETF D versus the daily return of the end of day NAV of the ETF versus the daily return in the Total Return Index of the benchmark (in this case the NIFTY 50 TRI).
As is evident from the chart above, the daily return in the closing price of ETF D (Price Return – Benchmark Return represented by red dot) as traded in the secondary markets deviates significantly from the daily return of the benchmark. In-fact there are days around March and April where the deviation in daily returns can be as high as 4.0% positive and as low as 5.0% negative. Clearly the secondary market is not as efficient as we would like it to be. Around the months of March and April when volatility was high, the deviations jump even more and could have put an investor in the ETF at a significant advantage/dis-advantage based on which side his price got locked in. In contrast the Tracking Difference (TD i.e NAV return – Benchmark Return represented by black dot) of the fund deviates significantly less.
It would be instructive to compare how the variation of the secondary market price daily returns of this ETF from its benchmark compares against daily difference in returns of its own NAV versus the benchmark and one of the best index mutual fund difference in NAV return versus the benchmark return. This chart is provided below:
The spread in the daily closing price return difference of ETF D is significantly higher than the spreads in the return difference in ETF D NAV and the mutual index fund A NAV. The scale of the Y-axis of the above two graphs is not suitable in showing the full story (especially the Return Difference Averages). A third way to capture the differences is given below in a summarized table:
The above table encapsulates the complexity involved in ETFs. Let us assume that an investor buys his ETF units at the end of day. He has to buy at the end of day closing price. This is because, the investor gets to buy/sell units only at the secondary market price and not at the NAV of the ETF. The annualized standard deviation of the closing price return difference is about 50x (9.02% vs about 0.18%) that of the standard deviations in NAV of the ETF and/or the index mutual fund !! This implies that an investor in ETF D can expect significant uncertainty and deviation from the benchmark while purchasing/selling ETF units in the secondary market. So, even though the NAV of ETF D has a lower tracking difference (TD) than the NAV of index mutual A, in reality the investor cannot buy ETF D at its NAV, but has to buy ETF D at the secondary market determined price which can be at significant variation from the benchmark. Typically ETFs hire Authorized Participants (see http://passivefunds.in/index-funds-etfs/ for more information) to provide the necessary liquidity in the secondary market and ensure large deviations from the benchmark do not occur. However it seems at-least in the case of ETF D in the months of March and April when volatility was high, the liquidity provided was insufficient. Index ETFs provide the ability to purchase intra-day and not be restricted to end-of-day quotes from the fund. Nevertheless it is our position that for the investor who simply wants exposure to the index, it may be prudent to accept a slightly higher tracking difference (in terms of NAV) and go with a low cost index mutual fund instead of an index ETF. This way the investor can have more certainty on the price at which units are bought/sold. This index mutual fund route is also likely to more truthfully track performance (lower Tracking Difference (TD)) of the underlying index.