I was pondering over the topic for this month’s blog when my wife in the background was reminding me that our children’s end of term report cards were ready and that we need to collect them from the school. This set me thinking about Aroha Capital’s composite report card. Aroha Capital was incorporated in February 2013 and was awarded SEBI registration on October 7 2013. While I am reticent about reporting short term results and month on month variations, I felt come March 31, 2015, it would be 18 months since we secured our investment adviser registration and it may be appropriate to share a glimpse of how we have done.
The gold standard in presenting investment performance is the GIPS methodology. GIPS stands for Global Investment Performance Standards. GIPS is exacting, and by no means does this presentation of our performance conform to GIPS. For starters, GIPS requires that the precise date of cash inflow/outflow into a portfolio needs to be considered while calculating returns. Aroha Capital does not have the bandwidth to meet this requirement. We employ monthly rests to calculate underlying high-water marks. Not only will our presentation below violate this standard of GIPS, it will violate a slew of other standards into which I would prefer not to dwell presently. Infact, it has been this inability to conform to GIPS reporting, that has been the reason I have stayed away from talking publicly about performance thus far.
Please keep the above qualification in mind while reading further. For starters each of you – my clients – have different benchmarks. The various benchmarks chosen by clients include the (i) CPI rate of inflation +2%, (ii) SBI One Year FD rate, (iii) BSE SENSEX and (iv) BSE Small Cap Index. Ideally the benchmark has been mutually chosen to reflect the underlying risk appetite of the client – nevertheless in specific cases, clients with high-risk appetite have chosen a low risk benchmark. Each of you already receive individual holding and performance reports wherein your holdings and portfolio performance are reported on a monthly rest basis.
How then should I report performance on a composite level? Let me explain. GIPS standards say that performance of a composite portfolio should be benchmarked against a composite benchmark that reflects the underlying risk profile of the portfolio. The construction of such a composite benchmark is beyond our resource capability. Nevertheless, I have added all client high water marks and have treated this as a proxy for a composite benchmark. This is not very fair since as I have mentioned above, some clients have chosen low risk benchmarks with underlying high-risk portfolios.
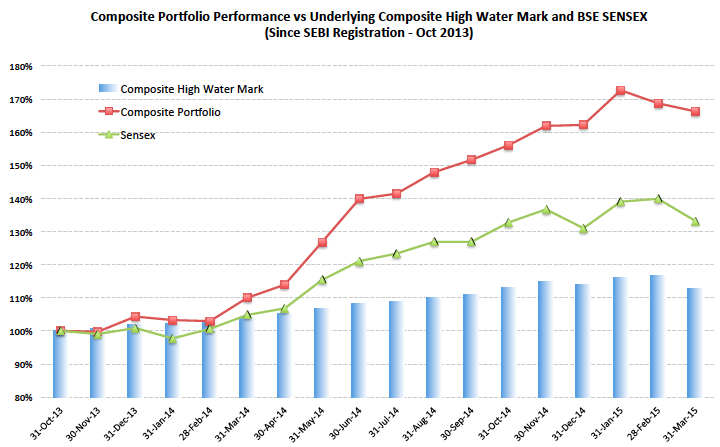
As you can see from the chart, in the last 18 months, the composite portfolio has raced ahead of the underlying composite high water mark. This is on account of two major reasons – (i) some clients have chosen low risk benchmarks and have undertaken high-risk portfolios and (ii) it so happens that the starting point of October 31, 2013 also corresponds to roughly the start of the current bull rally. We all know that during bull rallies, high-risk portfolios out perform the indices and this is not an indication of superior investment advice from yours truly.
The other point to note from the above chart is that, due to the massive outperformance of the composite portfolio versus the composite high water mark, there is a significant fee payable to the investment adviser as of March 31, 2015 (The fee payable every year is 25% of the outperformance as on March 31 of that year). In my blog of September 30 2014, I had cautioned against this massive run up of client portfolios against the underlying high water marks and said that instead of taking out all fees at one go, to protect clients against future under performance, we will stagger fee payment to just 25% of the fees payable and retain the rest within client accounts – in other words the fee payable every year would now be 25% of 25% of the outperformance as on March 31. The high water mark will then be corrected for this part fee payment. The detail is illustrated below:
OUTPERFORMANCEtime = MAX ( (PORTFOLIOtime - HIGHWATERMARKtime) , 0 )
FEE31-Mar-yy = 0.25 X 0.25 X OUTPERFORMANCE31-Mar-yy
NEWHIGHWATERMARK = PORTFOLIO31-Mar-yy - 0.75 X OUTPERFORMANCE31-Mar-yy
It is only at the point of termination of the investment advice contract that all fees due at the point of termination will have to be paid. This is illustrated below:
FEEtermination = 0.25 X OUTPERFORMANCEtermination
It is to be noted that even at this time the client pays only for the outperformance generated at the point of termination – and at no point in time will she ever have to pay a fees when her portfolio is underperforming the benchmark. Many well wishers have cautioned me against this step of staggering fees. They have made the point that as the years go by and if Aroha Capital continues to outperform the underlying high water marks, the accumulated component of fees that is embedded within client accounts would get eye popping. At that point in time if clients for whatever reason decide to disengage, they may baulk at paying fees that is fairly due to Aroha Capital. I realize this is a definite possibility and a risk that I undertake. However, I firmly believe that the goodwill I generate from staggering my fees and protecting clients against future under-performance will ensure clients stay true to our agreed upon contracts. Only time will be the judge of Aroha Capital’s superior investment advice. I look forward to bringing a similar note to you on March 31, 2016, reporting on one more year of composite performance.