It is the time of the year to take stock of how things have panned out in the financial year gone by. Clients have a choice of three benchmarks to choose. The first benchmark being a low risk benchmark such as the SBI one year FD rate/CPI rate of inflation +2%, the second being the BSE SENSEX price index and the third and highest risk benchmark being the BSE SMALL CAP price index. These indices are very different from each other and reflect the portfolio risk the client has undertaken. .
Aroha Capital was started on the foundation that the efficacy of the investment advice we render, MUST have an objective yardstick to be compared against. We believed that the best way to reflect these objective yardsticks was to have benchmarks that reflect the kind of portfolio risk the client was undertaking. In doing so we adopted the above three benchmarks and measured each client portfolio against the specific chosen benchmark amongst the above three. For clients portfolios benchmarked against higher risk benchmarks, We do believe this is best way to calculate value created by the investment adviser. However, in tying everything to an objective benchmark, we wonder whether there are aspects to the investment advice we provide that are not captured through these benchmarks, for which Aroha Capital should appropriately price its services. The most important of which is probably the fact that we are Registered Investment Advisers and that the fiduciary role that we play MUST have some value. We will leave this discourse for a later blog as we ruminate through this idea and have one on one discussions with each of you over the months ahead. In October 2018, our investment adviser license is coming up for renewal and we need to take a hard look at how our business has performed over the last 5 years, before we apply and pay for a renewal.
Coming back to the subject of this blog, the simplest way to see how we have performed is to check just two numbers in the monthly portfolios we provide you – the portfolio value and the high watermark. If the portfolio value is higher than the high watermark, our advice has created some value for you over and above the benchmark returns. To present our performance at a composite level, we simply add all the portfolio values (after fees) and compare this total against the sum total of all the high watermarks – for sure there would be significant variation at an individual client level – but a composite picture should hopefully provide (at-least for us) a sense of how we are doing.So how have we fared ? The table below is a continuing summary from last year’s performance with a new row added to the bottom for FY 17-18:
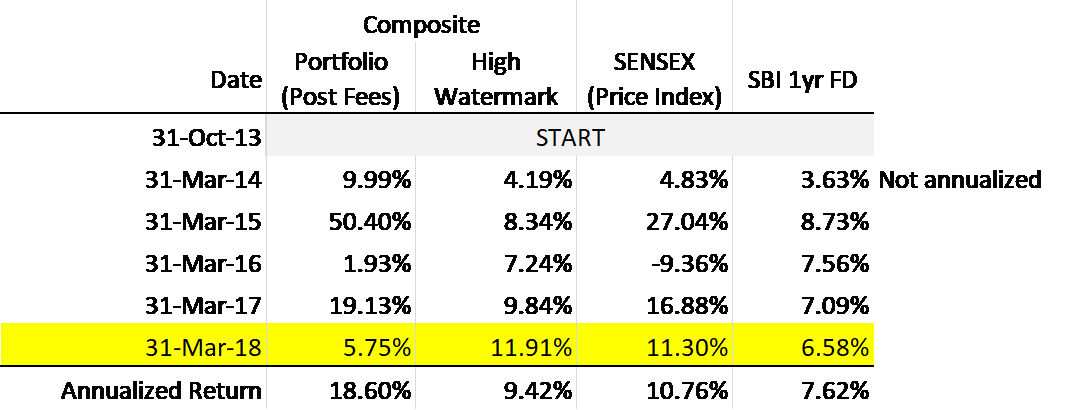
The year gone by has been dismal for Aroha Capital. Not only has our composite portfolio underperformed the composite high watermark, with the exception of few pockets of very meager outperformance, we have done poorly against chosen benchmarks in a large majority of our client portfolios. Our skepticism at the beginning of the year did not pan out. Higher risk benchmarks such as the BSE SENSEX price index and the BSE SMALL CAP price index, continued to rise through the year (with the exception of some recent pull back). Our conservative stance in client portfolios benchmarked to these indices while protecting our downside, has prevented us from capturing a large portion of the upside over the year gone by. Most of our individual stock picks too have performed relatively poorly. In lower risk portfolios, returns have been muted by mark to market losses on tax free bonds and bond funds in our portfolios due to the recent yield spikes. Is the law of averages catching up with us ? or is it that we indeed are superior capital allocators and this is just a passing phase wherein markets have raced ahead of fundamentals and over the long run we will ultimately out-perform – time only will ferret the answer to this question.
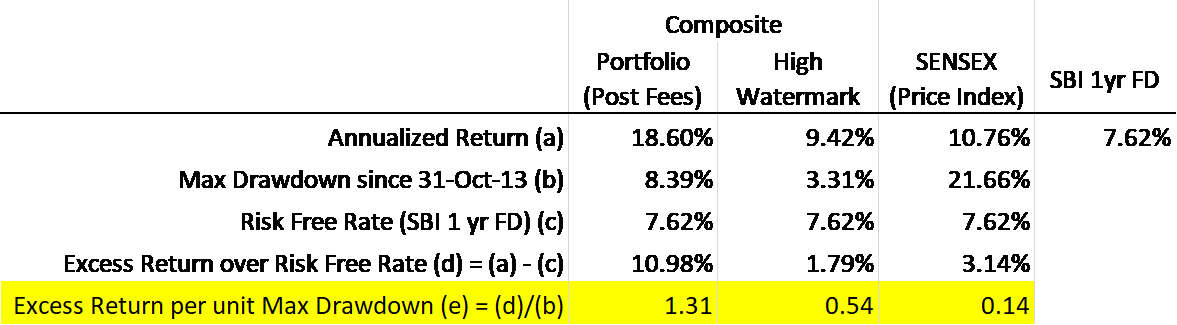
In a parting comment, we would like to, in fairness, point out that a measure of capital allocation skill is the excess return generated per unit of risk undertaken. We continue to do relatively well on this measure. Without getting caught up in very technical jargon, we measure risk in terms of maximum drawdowns i.e the maximum drop witnessed from any previous high. If we were to divide the annualized return generated in excess of a risk free rate (such as the SBI 1 year FD rate) by the maximum drawdowns witnessed, a more sunny picture appears. Our ability to generate excess return per unit of risk (drawdown) is about 2.5 times that of the portfolio benchmarks (1.31 vs 0.54) and about 10 times that of the BSE SENSEX price index (1.31 vs 0.14). I must caution the reader that this is early days yet and there are multiple ways to “game” this measure of capital allocation skill. Further, the table below is based only on 4.5 years of (unaudited) performance.
We leave you with this rather mixed picture, of our investment advise for the year gone by. i.e while we have under-performed our benchmarks in the financial year gone by (2017-18), our portfolios have continued to display relatively robust performances in the wake of large market wide drawdowns. Our investment philosophy continues to remain the same - i.e low churn, simplicity and tax efficient coupled with a dumb-bell strategy in security selection. With enough time, and the incessant application of sound investment principles we hope we can improve your investment outcomes. Thank you dear clients for one more year of your trust reposed in us.