Our composite portfolio is the sum total of all individual client portfolio values and our composite highwater mark is the sum total of all individual client high water marks. We have explained the concept of a highwater mark in a blog - High watermarking : 28-Feb-17. The performance being reported is a time weighted return (TWRR) as against the cash weighted return (XIRR) being reported in each of your individual portfolios. There is a distinction between the two, the subject upon which we have written a blog - TWRR vs IRR : 30-Apr-19.
The composite portfolio and composite highwater mark hold little meaning for the individual investor whose portfolio could be markedly different from the composite. However, as a matter of discipline and to get a sense of how Aroha is performing at a composite level, we have made it a practice to present our performance on an annual basis. Aroha’s (unaudited) performance on a composite level is reported in the table below:
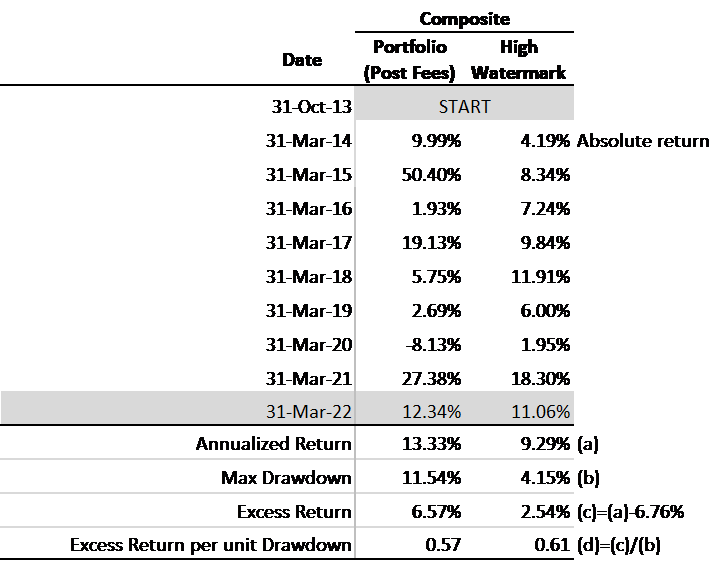
To avoid confusion, this time we are presenting only the composite portfolio performance vs the composite high-water mark. In the recent year ending 31-Mar-22, we have marginally outperformed the composite high-water mark by about 1.28% after fees. Since inception the outperformance on an annualized basis is about 4.04% (ie 13.33% - 9.29%). This may seem creditable. However, whenever measuring return, it is critical that we also measure risk. Our concept of risk is measured as maximum drawdown – which is the maximum drop in % terms the portfolio has suffered historically from the previous all-time high of the portfolio. The maximum drawdown suffered by the composite portfolio has been 11.54% vs 4.15% for the composite high-water mark. Clearly the composite portfolio is undertaking higher risk than the composite highwater mark. A fairer comparison would then be to normalize return for the risk undertaken. This normalized return we show in the last row of the table as the excess return per unit drawdown. The excess return per unit drawdown for both the composite portfolio (0.57) and the highwater mark (0.61) are similar, indicating that the excess return generated by the portfolio is very likely only because of higher risk undertaken and not because of manager out-performance. Presenting composite portfolio results as above, capture errors of commission. These errors manifest themselves in risk adjusted returns lower than the benchmarks set. In other words, Aroha has not made many errors of commission but could do a better job.
Interestingly, there is another source of errors where we feel Aroha has done well in – which unfortunately does not get captured in these tables above. These are errors which we have helped clients duck. For example, incurring permanent loss of capital by investing in stock tips, massively marketed IPOs and other highly speculative ideas, investing in costly whole life/endowment policies and complex AIF strategies, using expensive regular plans in mutual funds, taking on more expensive money-back / limited pay term policies, getting trapped into expensive home loan insurance products, paying high taxes on fixed deposits and other investment products, getting caught on the wrong foot in credit risk strategies and many more. We refer the reader to our blog - The Investing Game: 30-Jun-20 , the crux of which is that investing is more about avoiding costly errors and less about very high return. We thank our clients for one more year of your trust. We hope to continue to act as your fiduciaries and guard your wealth zealously.